Use cases
Visualize geospatial data
Display geospatial and business data to help make decisions and improve operations.

Improve operations
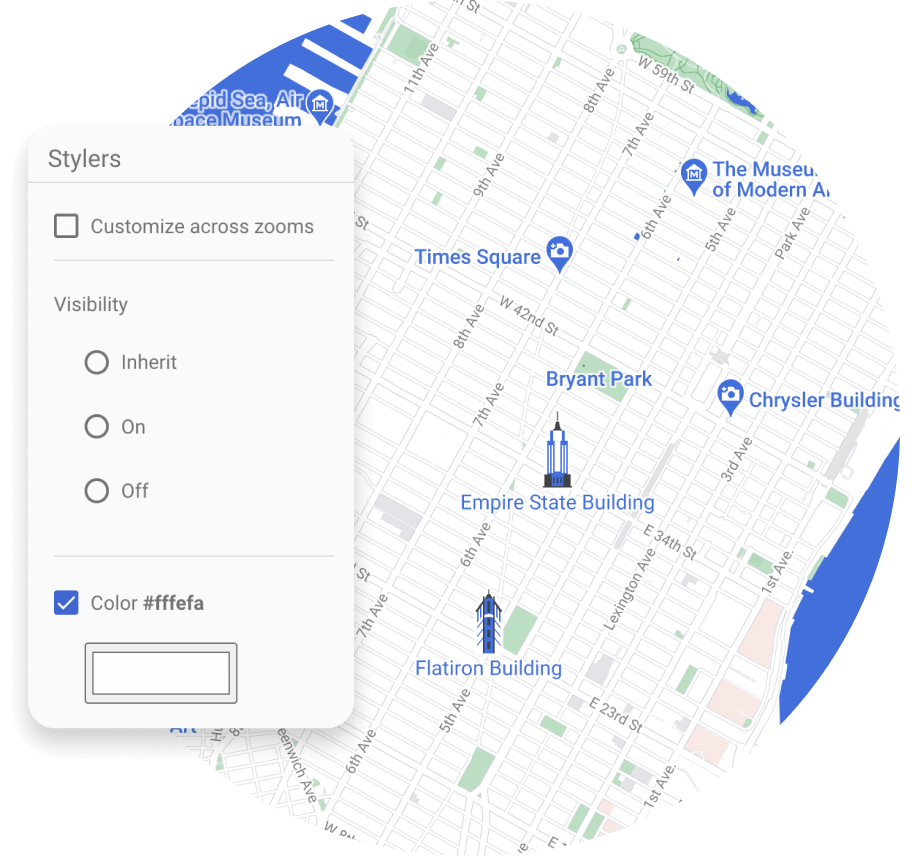
Customize maps
Display boundaries
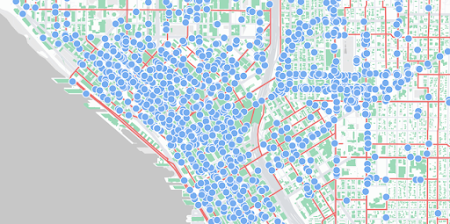
Visualize data


Helpful features
Products built for visualizing geospatial data

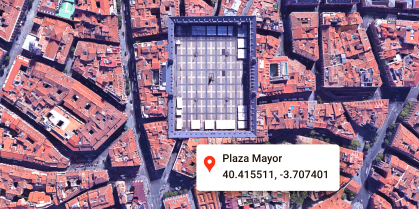
3D Maps
Create Photorealistic 3D Maps in Maps JavaScript using Google’s rendering technology.
Learn more

Aerial View
Delight your users with pre-rendered, 3D cinematic video of points of interest and their surroundings.
Learn more
Dynamic Maps
Customize and style interactive maps using Cloud-based maps styling for real time updates across all devices and platforms.
Learn more
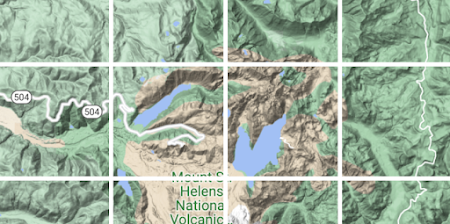
Map Tiles
Design interfaces and interactions unique to your brand and design requirements, and customize your visualizations.
Learn more

Photorealistic 3D Tiles
Access a 3D mesh model of the real world and use the renderer of your choice to create cinematic experiences.
Learn more
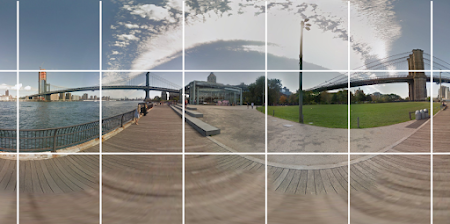
Street View Tiles
Use images taken from street level and tile metadata to create powerful, immersive experiences.
Learn more
Geocoding
Convert addresses to geographic coordinates or the reverse.

Places UI Kit
Bring the familiar Google Maps UI for Places to your front-end applications with just a few lines of code.
Learn more

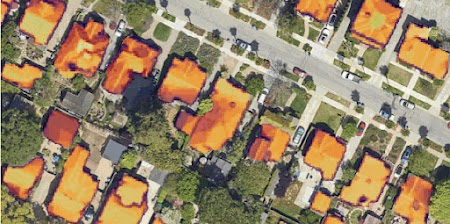
Solar
Use advanced data and imagery to create more advanced solar array designs and proposals, while eliminating costly site visits.
Learn more
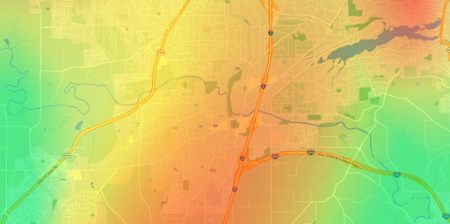
Pollen
Improve daily life for allergy sufferers with up-to-date information on different types and levels of pollen.
Learn more


The Google Maps interface was a big selling point in getting dozens of agencies to buy into working with dotMaps...thanks to a partnership with Google, the City of Chicago is showing people that government can embrace innovative solutions, make their money go further and improve their lives.
Lawrence Olzsak
IT Director, Chicago Department of Transportation


-
*Free usage refers to monthly calls available at no cost. Essentials Map Tiles APIs provide up to 100,000 calls at no cost per SKU per month.
-
Product availability, functionality and terms may differ for customers with billing addresses in the European Economic Area (EEA). Learn more