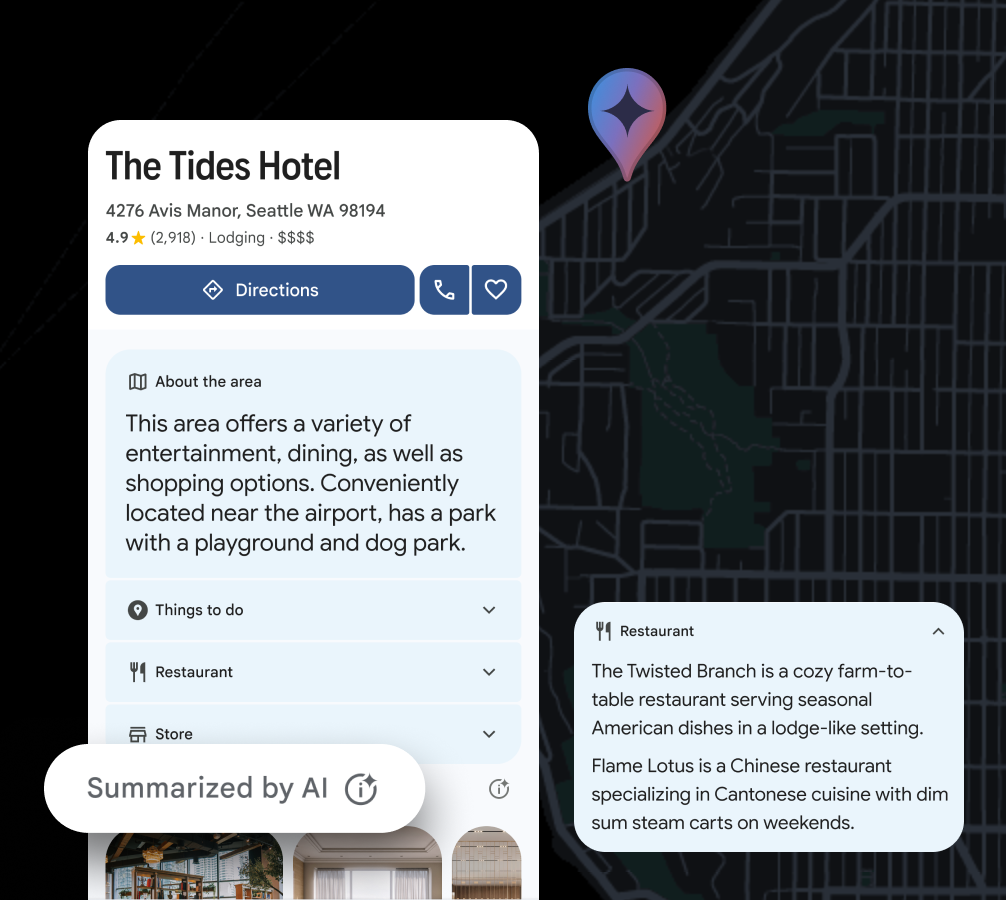
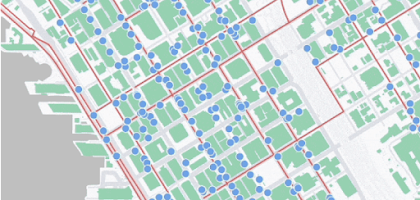
Help your business make more informed location-based decisions
See different use cases and examples of how businesses can use Places Insights data within BiqQuery to make location-based insights, like where to place a new store.
Build maps that allow customers to build brand connection, trust and loyalty.
Explore an immersive Retail demo to show brands how they can bring the real and virtual worlds together to deliver engaging and delightful experiences.
Explore a custom map built to display content creatively, with a unique mix of products and features, including Street View Tiles and Advanced Markers.
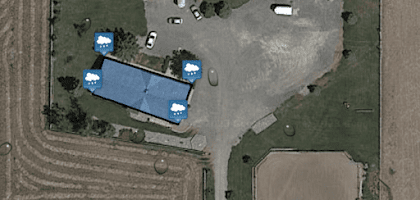
An augmented reality map to guide college students to recycling trash cans on campus.
The California State University Fresno campus has many recycling trash cans. This augmented reality map helps students find the closest location to increase recycling rates, decrease landfill mass, and contribute to sustainability.
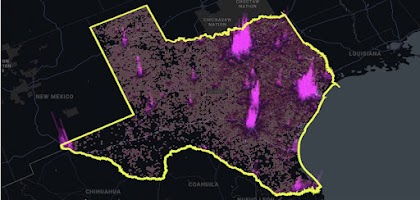
A 3D visualization of the USDA’s crop progress dataset for the 2021 corn growing season.
This app visualizes the USDA crop progress dataset in 3D throughout the 2021 corn growing season. Elevation, latitude, longitude, and state boundaries help give environmental context.
Interpret soccer analytics data and visualize them on Google Maps.
Kicky uses free soccer analytics data sources to visualize soccer moments on Google Maps in real-world coordinates. It enables users with no coding or analytics experienced to analyze this data. Kicky was the winner of “Best Data Visualization” in the Google Maps Platform Hackathon.
Calculate how much rain you can save from your own rooftop.
Inspired by estimated worldwide reductions in rainfall, the app uses maps to calculate how much water you could save in a year based on the size of your roof. Save the Rain was the winner of “Most Creative Experience” in the Google Maps Platform Hackathon.
When an environmental pollution incident occurs, SkyTruth uses a variety of maps to track and display the event and share the information with the public. Anyone interested can sign up for incident alerts for areas of interest with real-time map information.
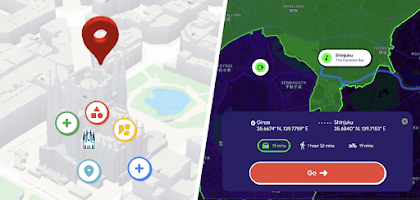
Explore two unique cities and learn how to build your own custom maps.
Take a grand tour through Barcelona and retro Tokyo to explore historical landmarks and unearth hidden mementos. See how Google Maps Platform products can help you build unique, interactive geospatial experiences.
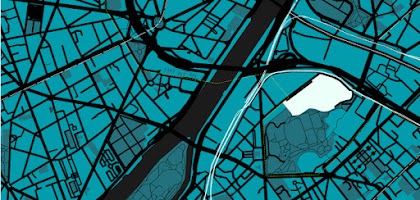
Explore a sample data visualization story that showcases the possibilities of custom maps.
Google Maps Platform and CARTO have collaborated to bring rich data visualization to web maps. This example uses multiple methods of visualization to tell the story of the potential electrification of truck fleets.
See how digital twins can be implemented using Google Maps API WebGL with 3D features.
Ubilabs created a demo, “Moving Hamburg,” to show how digital twins can be used to perform digital analyses and scenarios before being put to the test in the real world.
Join over 4 million people sharing their observations about the natural world.
iNaturalist, a joint initiative of the California Academy of Sciences and the National Geographic Society, allows you to track encounters with organisms around the world. With over 75,000,000 recorded observations so far, the crowdsourced data lives in the cloud and helps scientists understand when and where organisms are found.
Mix Maps and AR with Floom, the fun augmented reality app that lets you explore the other side of the globe.
Floom uses your location, and creates a tunnel to the other side of the globe - right in your browser. It was built by Google Creative Lab using the WebXR API and Dynamic Maps API.
Note: Floom is currently only available using Chrome on Android devices.
Take our new cloud-based maps customization for a test drive.
You can now create custom map styles right on the web. Our new cloud-based map styling makes it easy to tailor experiences for specific industries or customer needs. Try it out, and see how quickly you can create custom maps that publish simultaneous updates across all devices and platforms.
Travel the world in this interactive WebGL-powered demo.
Explore a new generation of mapping experiences with WebGL-powered Maps, and see how different the world can be when you control and render on the map in three dimensions.
Deck.gl is an open-source data visualization framework for the web that makes it easy to create 2D and 3D visualizations of large geospatial datasets. It allows you to composite multiple layers to analyze complex data in its real-world context and gain valuable insights.
Use 3D map tiles to display data in an engaging way
Understand the multiple benefits of vegetation in cities with this map demo. Learn how you can use 3D city imagery, heat mapping, layered visualizations, and other customizations using photorealistic 3D tiles.
Our Photorealistic 3D Tiles offer a seamless 3D mesh model of the real world, textured with our high resolution imagery, that uses the same 3D map source as Google Earth.
Easily access, display, and style Google’s polygons for administrative boundaries, or use your own geospatial data to create your own points, lines, and polygons.
Help your business make more informed location-based decisions
See different use cases and examples of how businesses can use Places Insights data within BiqQuery to make location-based insights, like where to place a new store.
Build maps that allow customers to build brand connection, trust and loyalty.
Explore an immersive Retail demo to show brands how they can bring the real and virtual worlds together to deliver engaging and delightful experiences.
Explore a custom map built to display content creatively, with a unique mix of products and features, including Street View Tiles and Advanced Markers.
An augmented reality map to guide college students to recycling trash cans on campus.
The California State University Fresno campus has many recycling trash cans. This augmented reality map helps students find the closest location to increase recycling rates, decrease landfill mass, and contribute to sustainability.
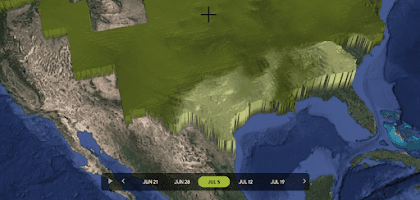
A 3D visualization of the USDA’s crop progress dataset for the 2021 corn growing season.
This app visualizes the USDA crop progress dataset in 3D throughout the 2021 corn growing season. Elevation, latitude, longitude, and state boundaries help give environmental context.
Interpret soccer analytics data and visualize them on Google Maps.
Kicky uses free soccer analytics data sources to visualize soccer moments on Google Maps in real-world coordinates. It enables users with no coding or analytics experienced to analyze this data. Kicky was the winner of “Best Data Visualization” in the Google Maps Platform Hackathon.
Calculate how much rain you can save from your own rooftop.
Inspired by estimated worldwide reductions in rainfall, the app uses maps to calculate how much water you could save in a year based on the size of your roof. Save the Rain was the winner of “Most Creative Experience” in the Google Maps Platform Hackathon.
When an environmental pollution incident occurs, SkyTruth uses a variety of maps to track and display the event and share the information with the public. Anyone interested can sign up for incident alerts for areas of interest with real-time map information.
Explore two unique cities and learn how to build your own custom maps.
Take a grand tour through Barcelona and retro Tokyo to explore historical landmarks and unearth hidden mementos. See how Google Maps Platform products can help you build unique, interactive geospatial experiences.
Explore a sample data visualization story that showcases the possibilities of custom maps.
Google Maps Platform and CARTO have collaborated to bring rich data visualization to web maps. This example uses multiple methods of visualization to tell the story of the potential electrification of truck fleets.
See how digital twins can be implemented using Google Maps API WebGL with 3D features.
Ubilabs created a demo, “Moving Hamburg,” to show how digital twins can be used to perform digital analyses and scenarios before being put to the test in the real world.
Join over 4 million people sharing their observations about the natural world.
iNaturalist, a joint initiative of the California Academy of Sciences and the National Geographic Society, allows you to track encounters with organisms around the world. With over 75,000,000 recorded observations so far, the crowdsourced data lives in the cloud and helps scientists understand when and where organisms are found.
Mix Maps and AR with Floom, the fun augmented reality app that lets you explore the other side of the globe.
Floom uses your location, and creates a tunnel to the other side of the globe - right in your browser. It was built by Google Creative Lab using the WebXR API and Dynamic Maps API.
Note: Floom is currently only available using Chrome on Android devices.
Take our new cloud-based maps customization for a test drive.
You can now create custom map styles right on the web. Our new cloud-based map styling makes it easy to tailor experiences for specific industries or customer needs. Try it out, and see how quickly you can create custom maps that publish simultaneous updates across all devices and platforms.
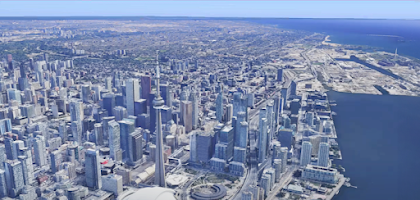
Travel the world in this interactive WebGL-powered demo.
Explore a new generation of mapping experiences with WebGL-powered Maps, and see how different the world can be when you control and render on the map in three dimensions.
Deck.gl is an open-source data visualization framework for the web that makes it easy to create 2D and 3D visualizations of large geospatial datasets. It allows you to composite multiple layers to analyze complex data in its real-world context and gain valuable insights.
Use 3D map tiles to display data in an engaging way
Understand the multiple benefits of vegetation in cities with this map demo. Learn how you can use 3D city imagery, heat mapping, layered visualizations, and other customizations using photorealistic 3D tiles.
Our Photorealistic 3D Tiles offer a seamless 3D mesh model of the real world, textured with our high resolution imagery, that uses the same 3D map source as Google Earth.
Easily access, display, and style Google’s polygons for administrative boundaries, or use your own geospatial data to create your own points, lines, and polygons.