If you want to present a lot of geographic information in an easily consumable form, you’ll probably use a map. But it has to be presented in a way that can be easily understood–with just a quick glance conveying the big picture and encouraging users to explore more.
Hundreds of data points clumped together can get in the way of clarity. In this post, we’ll cover how to use the marker clusterer library in JavaScript to communicate the same information in aggregate without all the overlapping markers. We’ll also cover a bit about how it works to help you better understand how you can tune marker clustering for your own projects.
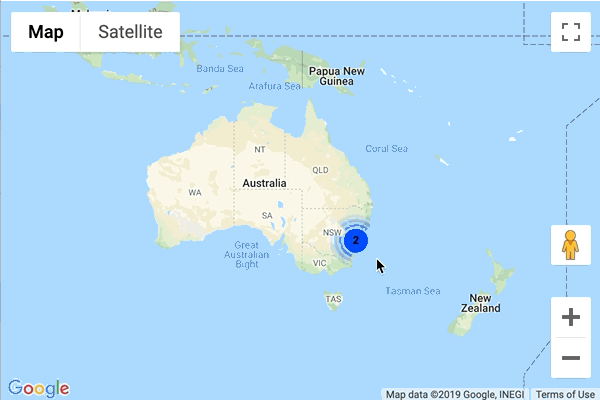
**Why use marker clustering?**Let’s start by taking a look at this map that shows a set of markers spread across Australia and New Zealand:

Even though we’ve provided useful labels for each marker, many of them are so close in proximity that they overlap and are not visible. There are fewer than 25 locations, but they’re close enough together that they can’t all be shown on the map without creating overlap.
If your map looks like this, it might keep users from absorbing all the great information you’re trying to present. This is where marker clustering comes in. With a simple open-source library and a small change to your map code, you can add marker clustering to greatly improve your user experience.

Marker clustering is a useful tool for visually consolidating markers, making it easier for viewers to understand a map as a whole by combining nearby markers on a map into a cluster, which is presented on the map as a single icon.
**Enable marker clustering on your map**You can add clustering to a map with just a few additional lines of JavaScript. This example focuses on web maps, but there is a similar utility within the Google Maps Platform Android and iOS SDKs. To create a marker cluster, let’s first look at how to create non-clustered markers. When you add typical markers to the map, the code might look something like this:
const pos1 = {lat: -33.727111, lng: 150.371124};
const marker1 = new google.maps.Marker({position: pos1, map: map});
const pos2 = {lat: -33.718234, lng: 150.363181};
const marker2 = new google.maps.Marker({position: pos2, map: map});With dozens or more markers, you’re unlikely to create them one at a time with their own variables. However, these two markers are enough to see clustering in action.
You’ll need two additions to your maps code to enable marker clustering. First, load the marker clusterer library. For production uses, you’ll want to download the source from GitHub and host the JavaScript on your own server.
<script src="https://[your_server]/[path]/markerclusterer.js">Next, pass the map and markers to the clustering library, adding these lines below your marker variables:
// create an array of all your markers
const markers = [marker1, marker2];
// Path for cluster icons to be appended (1.png, 2.png, etc.)
const imagePath = "https://[your_server]/[path]/images/m";
// Enable marker clustering for this map and these markers
const markerClusterer = new MarkerClusterer(map, markers, {imagePath: imagePath});Again, for production usage, you’ll need to host the cluster images on your servers. This example will load m1.png because it only needs the minimum cluster size.
When you create an instance of MarkerClusterer, you pass your map variable, markers array, and the image path. From that information, the marker clusterer library takes over and displays the cluster icon with a count of the number of points contained in the cluster:

Click on the cluster icon and the map bounds will zoom to the level where both markers are visible:

When you zoom out a few levels, the cluster icon will return in place of the two markers once the map is at a level where they’d be likely to overlap.
See the marker clustering guide for a complete example with more points, or read on for more about how marker clustering works and the options you can tweak for your own projects.
**How marker clustering works**The marker clustering library is part of the open source map utilities on GitHub. You can access all of the code and even make changes if needed. Let’s take a high-level look at how the algorithm works.
To begin, the algorithm divides the map into a grid, with each section of the grid defaulting to 60x60 pixels. Using the dense marker example above, it could be visualized like this:

In reality, the grid won’t be exactly like the above, as it’s based on the markers themselves. The first marker becomes the center of the first sector. Subsequent markers within that sector will be added to a cluster for that sector, then the center of a cluster will update based on the average of all its markers. If a marker could potentially be part of multiple clusters, it will be added to the nearest based on the distance between marker coordinates.
The default settings and algorithm will cover most use cases, but since the code is entirely open source, you can make any changes you need.
**Customize your marker clusters**There are many ways to adjust how your marker clusters look and function. Many of them won’t even require that you make edits to the underlying library. Instead, there are a number of options you can set when you create your clusters.
The easiest way to make a clustered map your own is to use your own icons. In the simple clustering example, we passed the imagePath option. The cluster library will add a number (1-5) to the end of the path, followed by the file extension, which defaults to .png. You can use a different file type with the imageExtension option. Keep in mind that transparent icons will look best on a map.
By default, it only takes two markers to make a cluster. You can use the minimumClusterSize option to change this setting. Increasing this number could cause overlapping markers, but allows you to set a threshold for how many might overlap.
Here are some other options to try with the marker cluster library:
-
gridSize: the number of pixels within the cluster grid -
zoomOnClick: whether to zoom in on a cluster when clicked -
maxZoom: what farthest level you can zoom in before regular markers are always displayed -
styles: an array of objects for each cluster type that includes textColor, textSize, and other features of the cluster
For example, you could use all of the above options together with a call to the cluster library like this:
// Options to pass along to the marker clusterer
const clusterOptions = {
  imagePath: "https://[your_server]/[path]/images/m",
  gridSize: 30,
  zoomOnClick: false,
  maxZoom: 10,
};
// Add a marker clusterer to manage the markers.
const markerClusterer = new MarkerClusterer(map, markers, clusterOptions);
// Change styles after cluster is created
const styles = markerClusterer.getStyles();
for (let i=0; i<styles.length; i++) {
  styles[i].textColor = "red";
  styles[i].textSize = 18;
}If the above options were applied to the Australia and New Zealand example, your map would look something like this:

You’ll notice two things right away: there are more clusters (due to the smaller grid size) and the numbers are red and quite a bit bigger.
Click a cluster and it won’t zoom for you. Instead, you can manually zoom in. Individual markers will appear quicker than before, mostly due to the grid size providing less chance of marker overlap. Once you reach zoom level 10 (the map starts at level 3), all markers will be displayed regardless of how close they appear.
At this point, you’ve gone from a densely-markered map to one that is elegantly clustered. Use this new knowledge to give your users a better experience on maps that show many markers. You can also find even more ways to customize the marker cluster library when you read through its code.
For more information on Google Maps Platform, visit our website.

