Whether we’re talking about desktop browsers or the mobile web, users have come to expect web apps that give them what they want with smooth, fast UI performance. For JavaScript developers, this means optimizing performance becomes one of the biggest concerns. The difference between a site that lags or responds slowly and one that doesn’t is the difference between attracting and retaining users or losing them, and apps that deliver mapping or other location-based features are no exception. Recently I gave a talk on this topic, and I want to recap some of the tips I gave.
Using custom overlaysCustom overlays allow you to render custom geospatial data on top of the map that moves along with the map when the user drags or zooms. We see a lot of developers use this as a way of placing their own data, such as markers, on the maps. This is done in OverlayView.draw():
MyOverlay.prototype = new google.maps.OverlayView();
/** @constructor */
function MyOverlay(map, ...) { ... };
MyOverlay.prototype.draw = function() { ... };This is a perfectly good way to build a custom map, but if you’re going to do this, it’s important to know that every time the user pans or zooms the map, we redraw the basemap as well as call your OverlayView.draw() to redraw your overlaid content. This is something you need to take into account if the logic for creating or updating your custom overlays is either compute heavy or blocking, since it can introduce some stuttering or lag into the overall map experience due to your code executing at the same time we are trying to redraw the map. Also, be sure to only execute the code you need in draw(). Anything not needed to actually execute rendering should be done beforehand to keep your call as lightweight as possible.
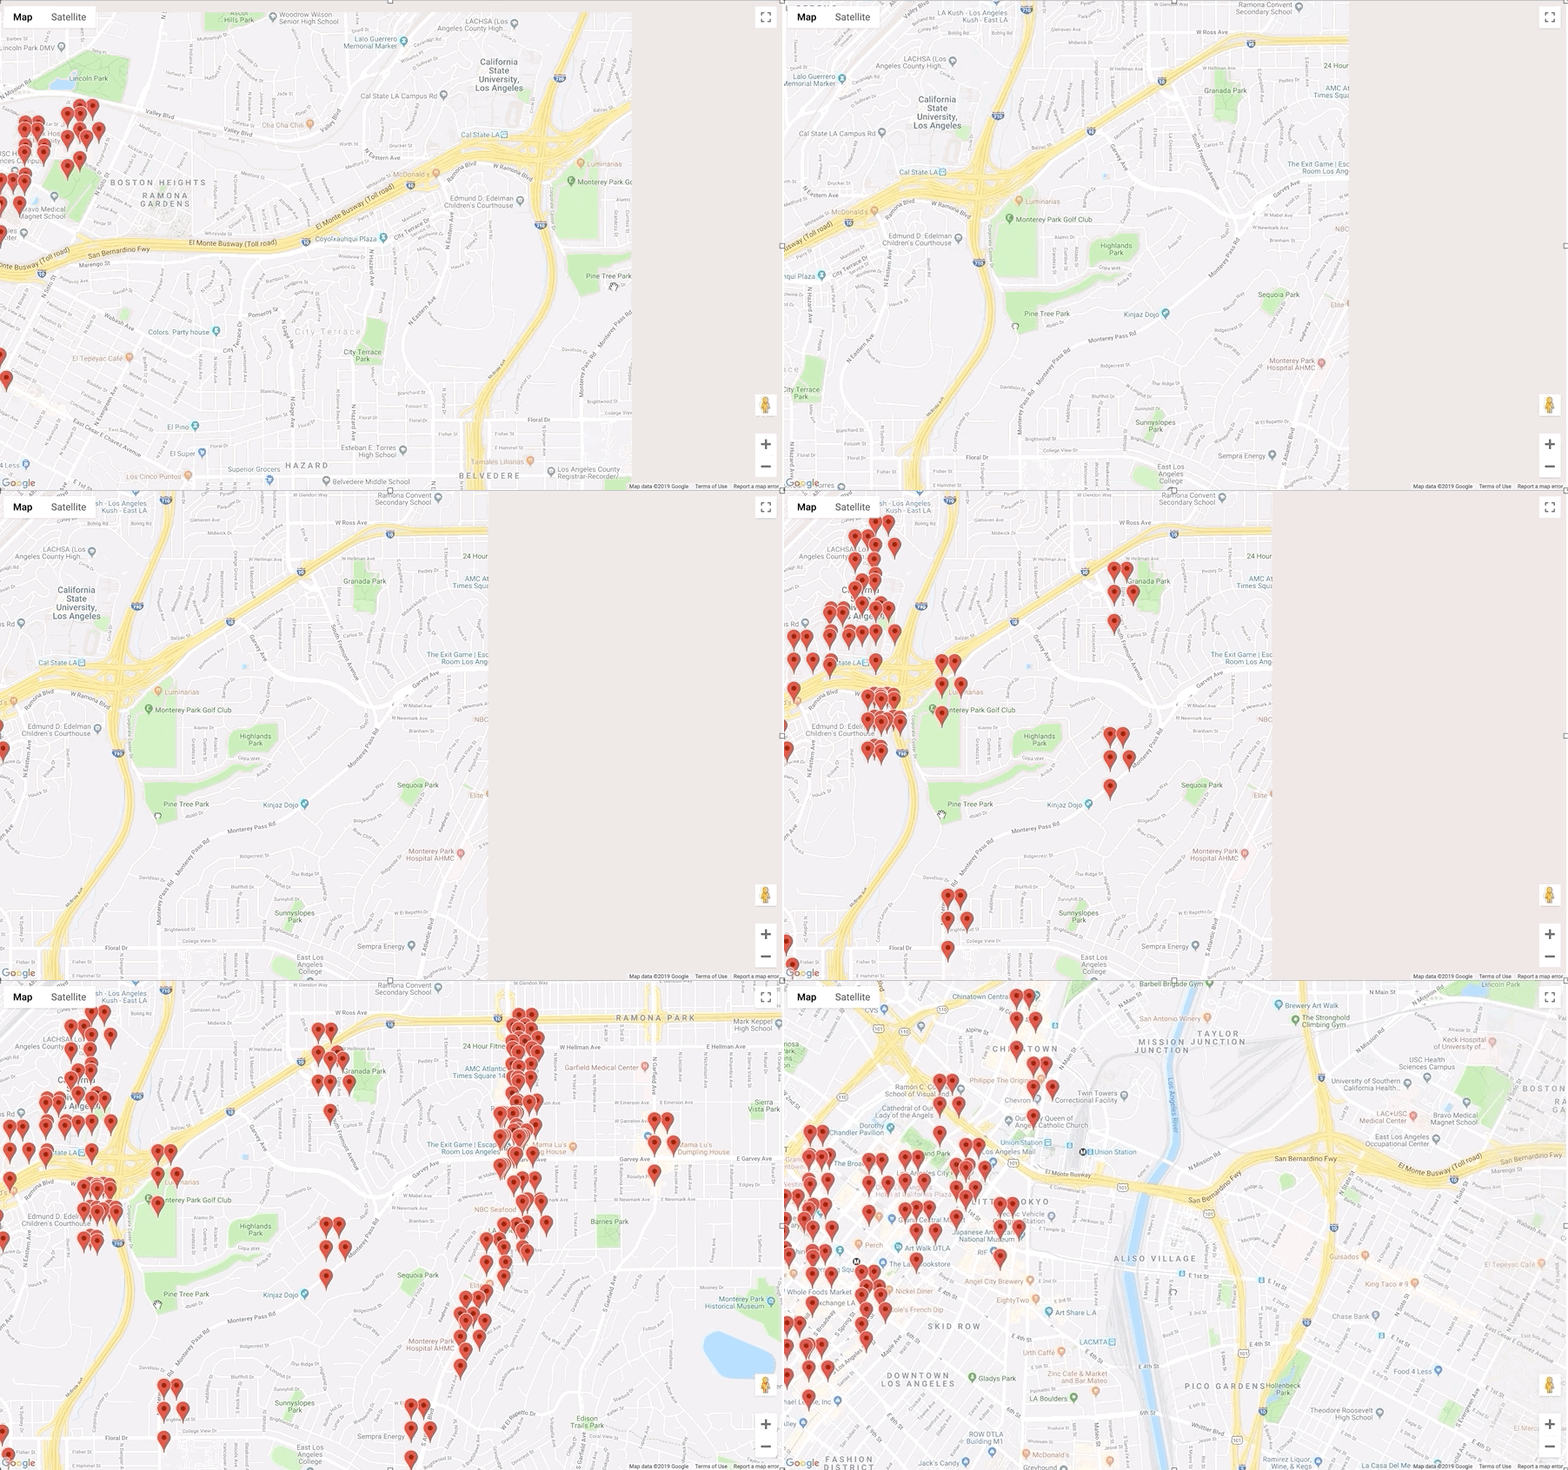
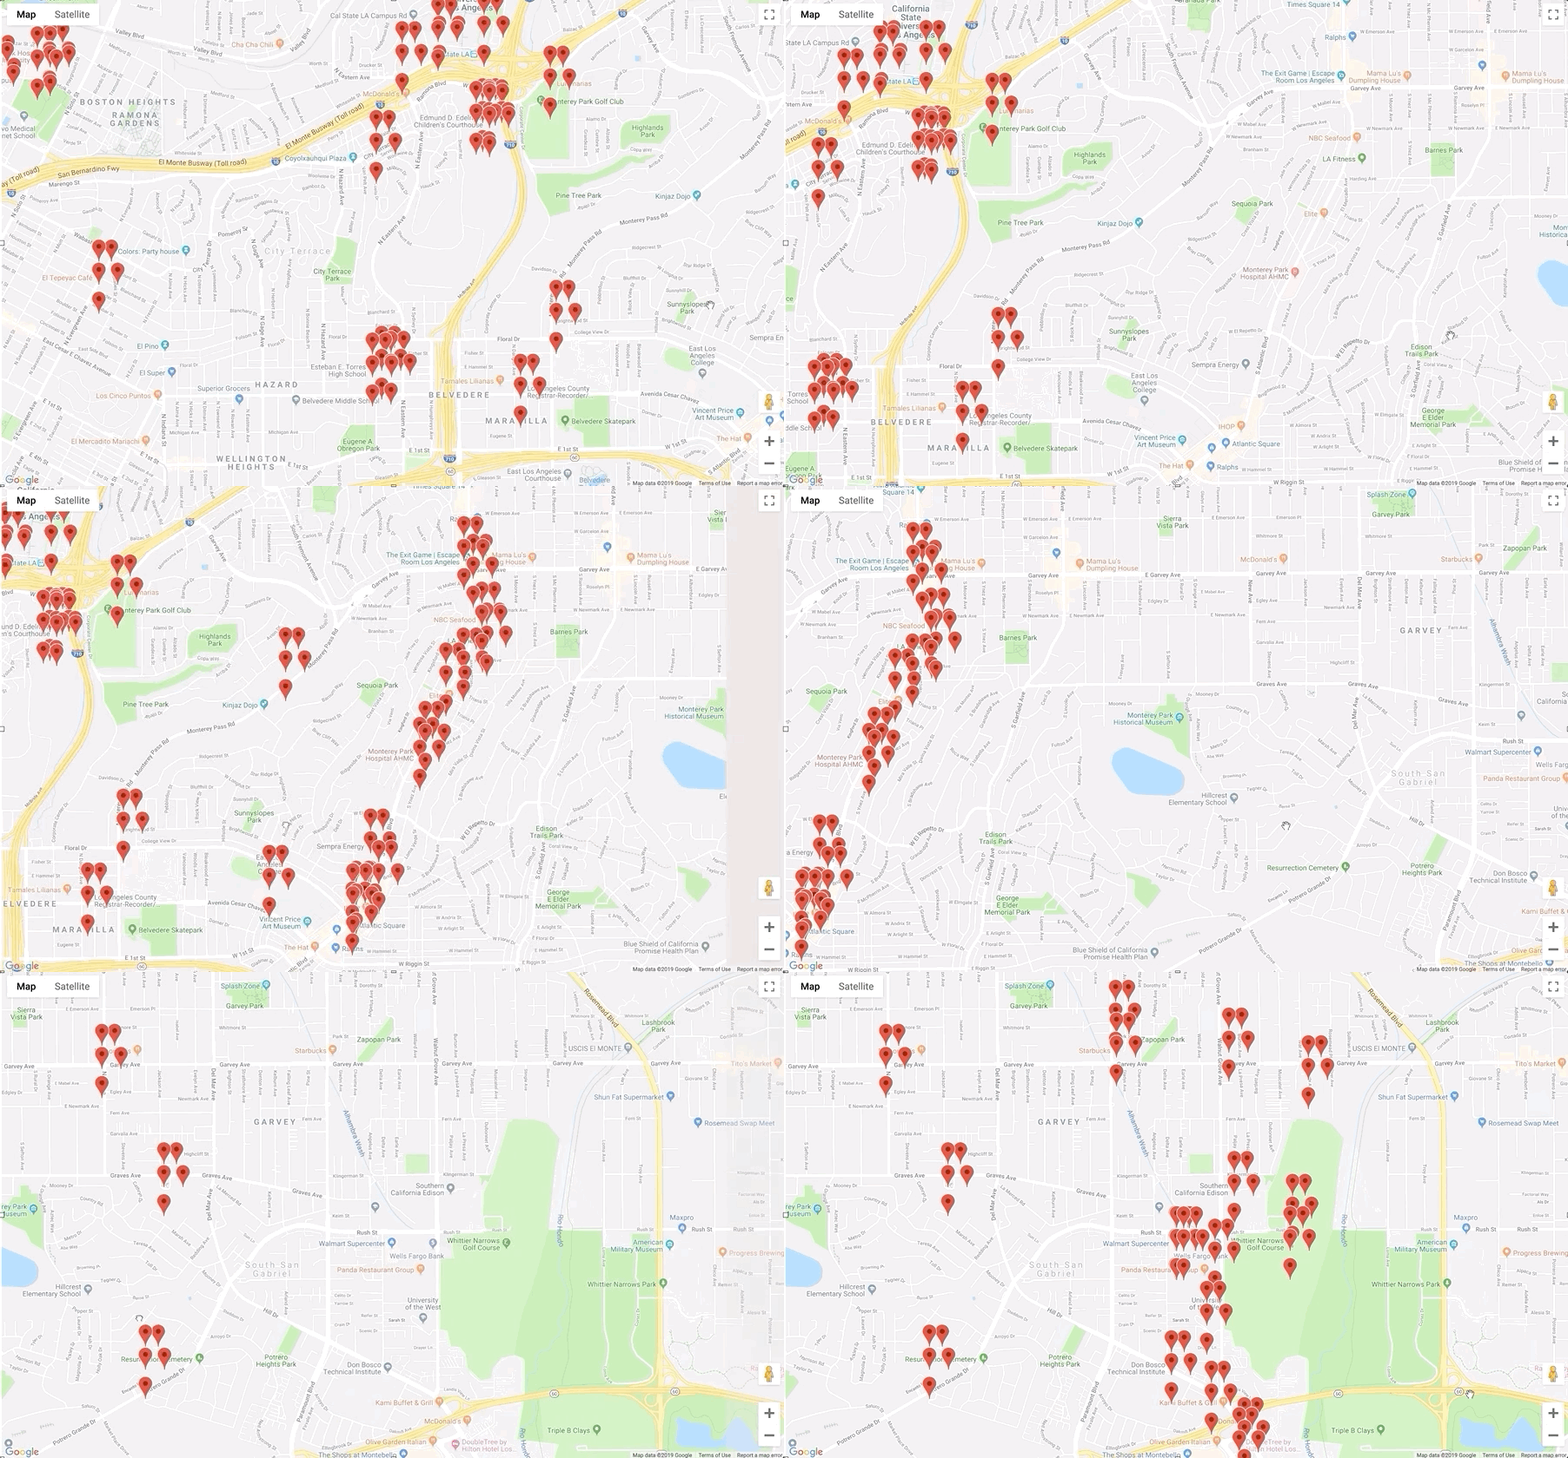
Here’s an example of a custom overlay that’s overlapping its rendering with the map rendering:

Another tip: create a better user experience by only adding or removing content when the map is stationary. A good best practice is to take advantage of events such as drag or dragend that will tell you when the user is interacting with the map, so you can avoid making changes to your custom overlays while we are redrawing. The same goes for adding and removing markers from the map.
Here’s what the earlier example looks like when we wait for the user interaction to complete:

Much better! Not only does the map perform better, you’ll also notice that we improved the user experience by only rendering markers in the view once the user stops panning.
**Using markers**Another way developers can add data to the map while maintaining a performant implementation is through the use of markers. A marker identifies a location on a map. By default, markers added to the map use our standard red pin, but you can also use custom images. Let’s take a look at what a performant use of markers might look like.
In this example, we have a method that generates 1,000 geocodes within a bounding box:
function initLocations(latMin, lngMin, latMax, lngMax, numPoints) {
  let latExtent = latMax - latMin;
  let lngExtent = lngMax - lngMin;
  let tmpLocations = new Array(numPoints);
  for (let i = 0; i < numPoints; i++) {
    tmpLocations[i] = {
        lat: Math.random() * latExtent + latMin,
        lng: Math.random() * lngExtent + lngMin};
    };
  }
  return tmpLocations;
}
...
let locations = initLocations(-33, 117, -22, 148, 1000);Next, we create some markers and add them to the map. Notice that we are specifying a custom .svg for the markers:
function initMap() {
    // initialize the map
    let map = new google.maps.Map(document.getElementById('map'), {
      zoom: 3,
      center: {lat: -25.906174, lng: 132.409812},
    });
    // Add the markers to the map
    let markers = locations.map((location, i) => {
      return new google.maps.Marker({
        icon: './images/pin.svg',
        position: location,
        zIndex: i,
        map: map
      });
    });
    // Add event listeners to the markers
    markers.map((marker, i) => {
      marker.addListener('mouseover', () => {
          toggleIcon(marker, true);
      });
      marker.addListener('mouseout', () => {
          toggleIcon(marker, false);
      });
    });
    ...
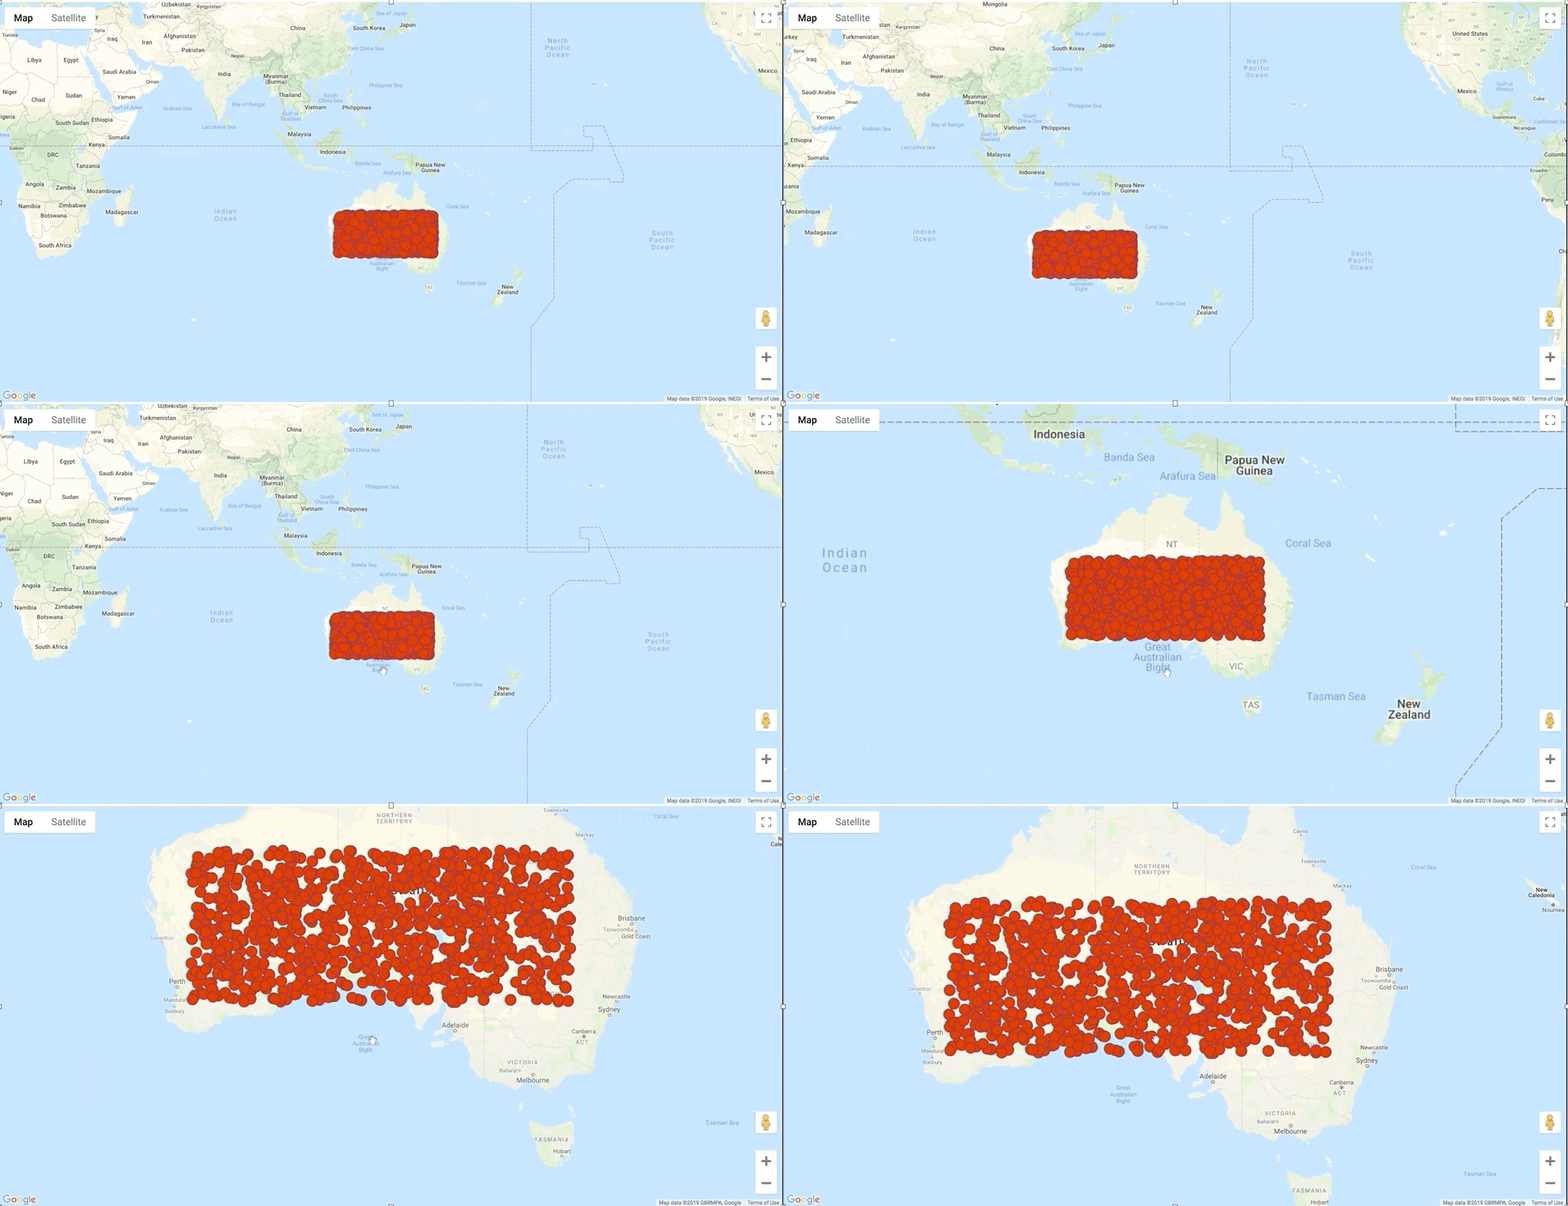
}Now take a look at what happens when we interact with the map:

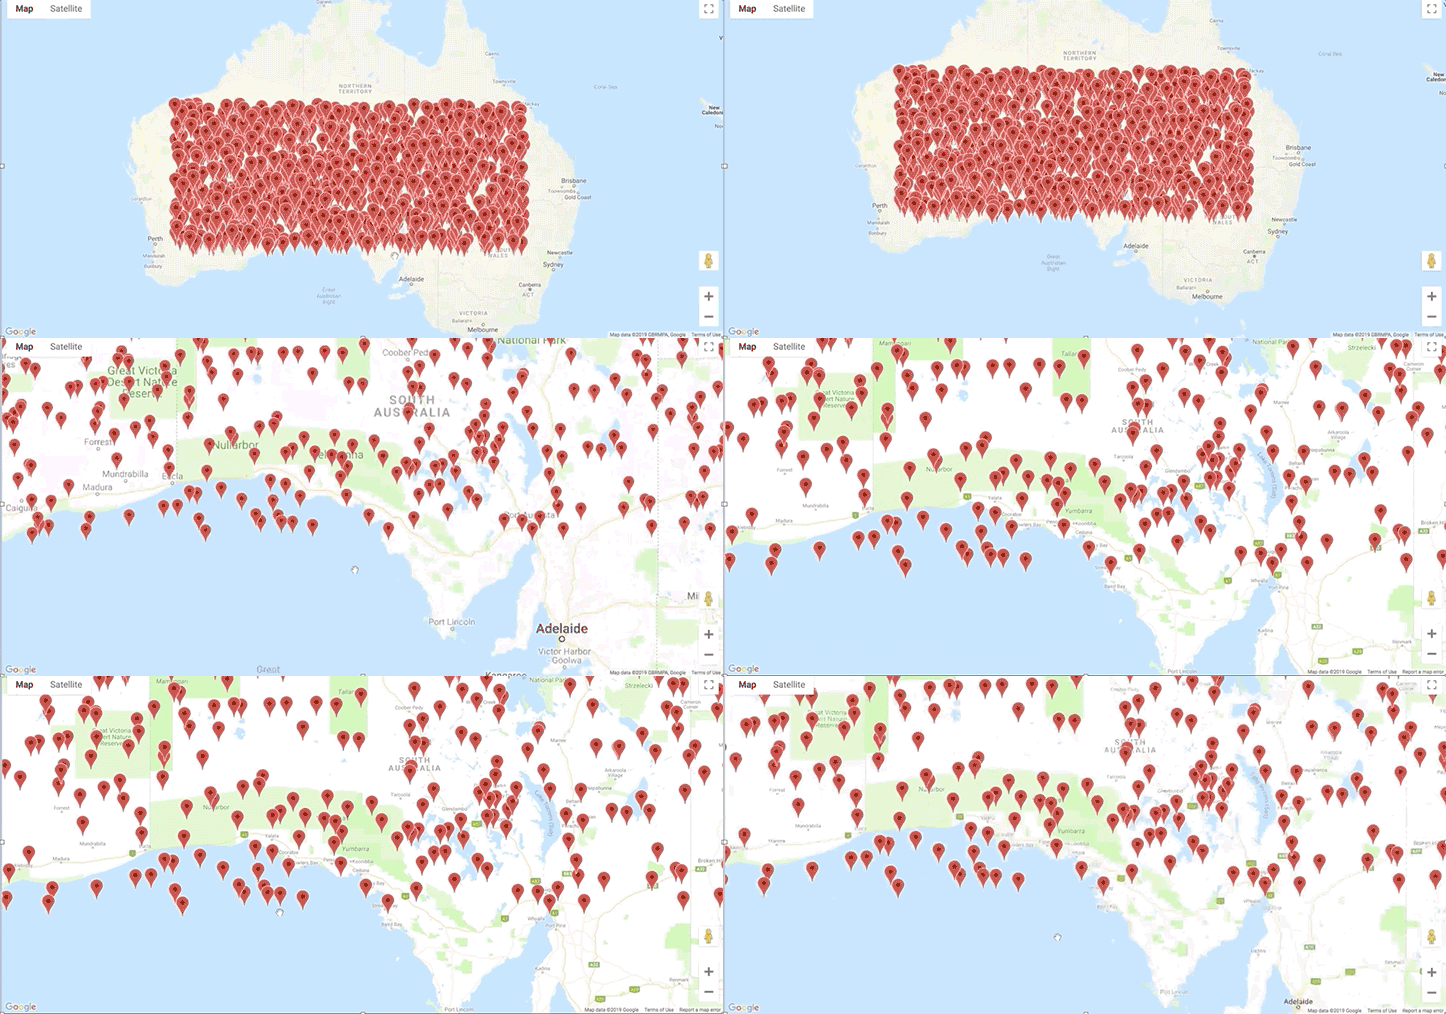
Notice how there is lag when we pan and zoom. Now, let’s make a simple change by switching to a raster image (in this case a png) for our markers in the `Icon` property of the code snippet above:

No more lag! Although in many cases svg images perform better on the web, we actually implement special optimizations for rendering custom markers with raster images when a large number (think multiple hundreds) of markers are being rendered all at once. So the takeaway here is to use raster images for better performance if you intend on putting a lot of markers on the map.
**What else?**This covers just a couple of the things you can do to optimize your usage of the Maps JavaScript API, but there’s always more to be done depending on what’s important to your implementation. For example, marker clustering is a must for maps that display a lot of markers.
For more about the Maps JavaScript API, check out our docs. And if you missed my talk, check out the video to also learn more about what we have planned for Google Maps Platform.